Creating a new report
Creating a report from scratch is generally a simple task. And with some examination of existing reports and a little bit of trial-and-error, you will soon learn the more complex aspects of the Report Builder. You can create a report just for yourself (private), for other administrative users (public), or for those users who only use Dovico to enter time and expenses. In all these cases, the fundamental steps to create a new report are very similar and are contained in 5 tabs located in the Report Builder.
![]()
These steps are:
-
Mandatory - From the General tab, enter a name for the report, select the type of report and how the data is displayed.
-
Mandatory - From the Columns tab, select the data categories (columns, rows, data series) to display in the report.
-
Optional - From the Grouping tab, select how the data is grouped within the report (by project, employee, task, etc.).
-
Optional - From the Sorting tab, select how the data is sorted within columns in the report (ascending, descending).
-
Optional - From the Filters tab, select the filters available to those users running the report (date range filters, list of employees, list of projects, etc.).
|
Note: Any new report you create is only available to you (Private) until you publish that report. |
|
Tip: Instead of creating a new report from scratch, you should consider finding an existing report that has the data and formatting you are looking to create, making a copy (duplicate) of it and then modifying that copy. |
To create a new report:
-
Select Reports from the navigation bar (Reports > Reports).
-
Click the New Report button.
On the General tab -
Enter a Name for the report and optional Description. The report name should be unique.
-
(Optional) You may change the orientation of the report (Portrait or Landscape).
-
Select on what type of data to include in the report.
-
Time and Costs: This report type is primarily used to display the calculated costs generated by time entries. This report type limits data to the hours entered against projects and tasks that have been submitted and approved. Time entered but not submitted, or time waiting to be approved is not included in Time and Cost reports. Depending on how the data is displayed (standard, chart), you can show individual time entries with all their details, or choose to roll-up time entries. You can display their associated costs, proratings, pay or billing rates and other data used in calculating costs.
-
Budget and Actuals: This report type is similar to the Time and Costs type but includes budget information. This report type is primarily used to compare project budgeted time or budgeted costs against the actual data from approved time entries.
-
Time: The Time type reports provide summary or detailed information on time entries against projects and tasks. You can report on time whether it is approved or not. All time entry costs and their factors (hourly rates, overtime rates, etc.) are excluded from this type of report.
-
Expenses: Reports built using the Expenses type provide information on expenses for projects. You can report on expenses whether they are approved or not.
-
Time and Expense: The Time and Expense report type is used to display detailed costs data for both time and expenses. Only approved time or expenses are included in the data.
-
Lists: The List type reports provide detailed properties of various items entered into the database (Client, Employee, etc.).
-
-
Select how the data is displayed in the report.
-
Standard: These are 'typical' reports where data is shown in columns with the ability to group and sort the data. Most reports are built using the Standard display type.
-
Pie: Used to show the relative size of individual items that make up a total. Dovico pie charts display up to 10 slices.
-
Bar: Used to compare data as values shown in the vertical axis with the data labels organized along the horizontal axis.
-
Grid: Used to group data in an easy-to-read grid format similar to a spreadsheet with totals displayed at the end of each column and row. Included is the ability to group the data (by project, employee, etc.).
-
Raw Data: Used to display raw data in columns. Typically used to send data to Excel or another application.
-
-
Click the Next Step button or click on the Columns tab.
|
Tip: At any time while using the Columns tab, you can click the Run Report button to see your progress in building the report. |
A detailed explanation of each column, row or data series can be found in the Default columns help topic.
-
Select the data to appear in the report.
-
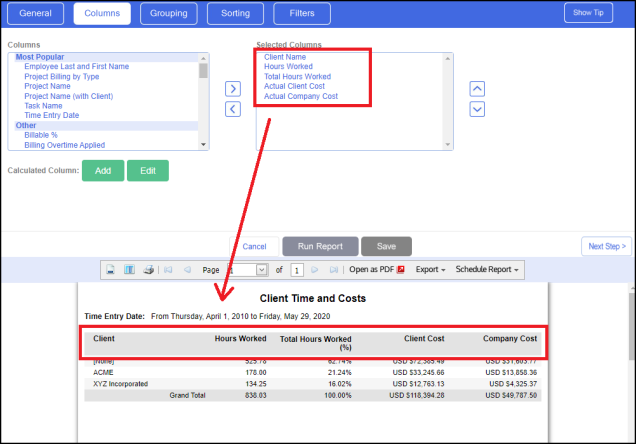
For Standard and Raw Data reports:
-
Select the data columns to place in the report and move them
 to the
Selected Columns list. The most commonly used data columns
are displayed at the top of the list.
to the
Selected Columns list. The most commonly used data columns
are displayed at the top of the list. -
You can re-order the columns in the report by selecting the column name and clicking the up or down arrow buttons. The topmost item in the Columns selected list appears at the left in the report preview.
-
The Column Format drop-down list is an advanced function and should not be modified unless Grouping is used. See step 13 below for instructions.
-
You have the option to add a Calculated Column in the report when there is a need to show data from a custom calculation. Details on adding a calculated column are found in the Calculated Columns topic.
-
-
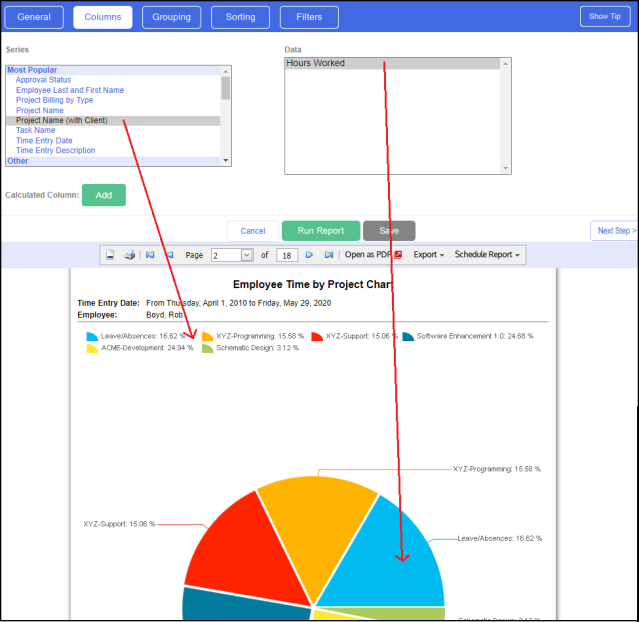
For Pie chart reports:
Example for a pie chart displaying total hours worked across projects.-
From the Series list box, select one item - select Project Name.
-
From the Data list, select the data to be distributed (sliced up) - select Hours Worked.
-
-
For Bar chart reports:
-
Example for a chart comparing client and company costs by project.
-
-
-
From the X-Axis drop-down, select one category of data to display along the horizontal axis - select Project Name.
-
Select the data columns to place in the report and move them
to the Columns Selected list - select Actual Company Costs
and Actual Company Costs.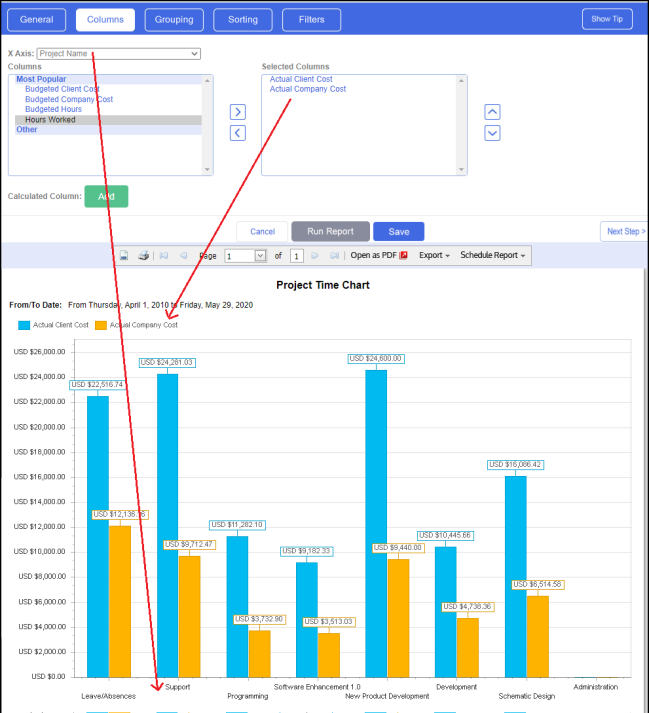
-
-
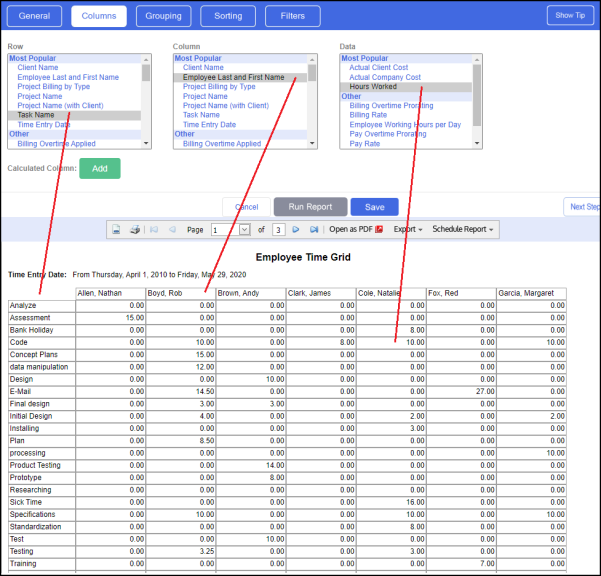
For Grid reports:
-
Select 1 item from each list box: Row, Column and Data
-
-
-
From the Row list box, select one category of item. The individual items from this category appear as row headings; Example; if you pick Task, then each indidvidual task appears in a row.
-
From the Column list box, select one category of item. The individual items from this category appear as column headings; Example; if you pick Employee, then each individual employee appears in a column.
-
From the Data list box, select the data to report on.
-
-
9. At this point all the mandatory steps have been completed. You may click Save to close the Report Builder. When saved, the report is placed in the Private tab. You may choose to publish it or keep it private.
|
Tip: If you don't like the name of the column shown in the report and want to change it, this can be accomplished using Calculated Columns. Review the Tip near the end of the Calculated Columns topic. |
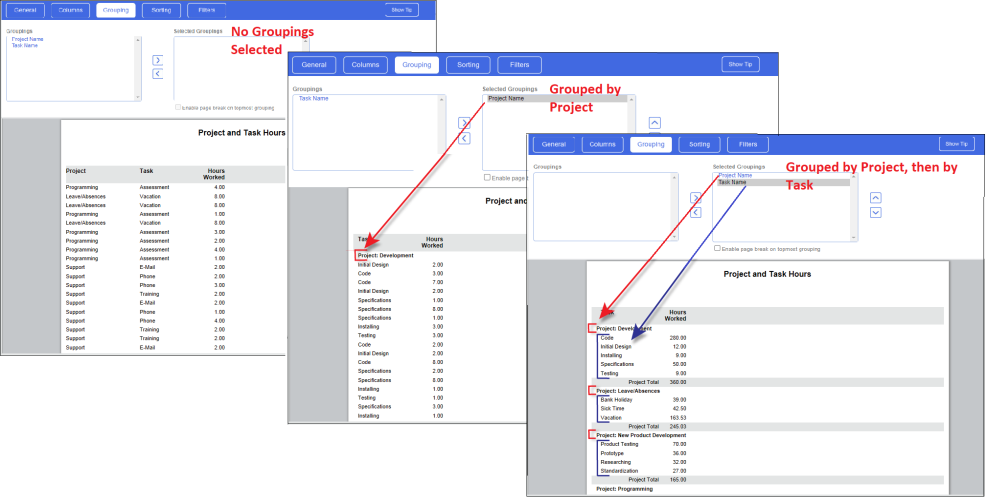
(OPTIONAL) On the Grouping tab
The Grouping tab is primarily used to organize longer reports into a more
convenient design or to roll up individual line items within a report.
Reports are commonly grouped by project, task, employee, date, etc.
-
From the Groupings list on the left, select the items to group by and move them to the Selected Groupings list. The available list consists of those items selected in the Columns tab that can be logically grouped.
-
When grouping by more than one item, re-order the items using the up and down arrow buttons.
-
Optionally check the Enable page break by topmost grouping option (not available for some report types).
-
You can use the Column Format drop-down list (located in the Columns tab) to change the calculation used to display the data within the column.
-
-
By default, when a numeric data column (hours, costs, etc.) is grouped, the individual line items of that group are rolled up and displayed as a Sum of the individual entries. Instead of showing the sum of the grouped data, you have the option to display the Min, Max, Average, etc. of that data set.
-
By default, when a data column that displays text (names, descriptions, etc.) is grouped, the Column Format option is set to [None]. You have the option to change it to Count.
-
The 'Formula' option is a special option useful when displaying the sum of the column's data at the bottom is not logical (see Column Format - Formula option).
-
|
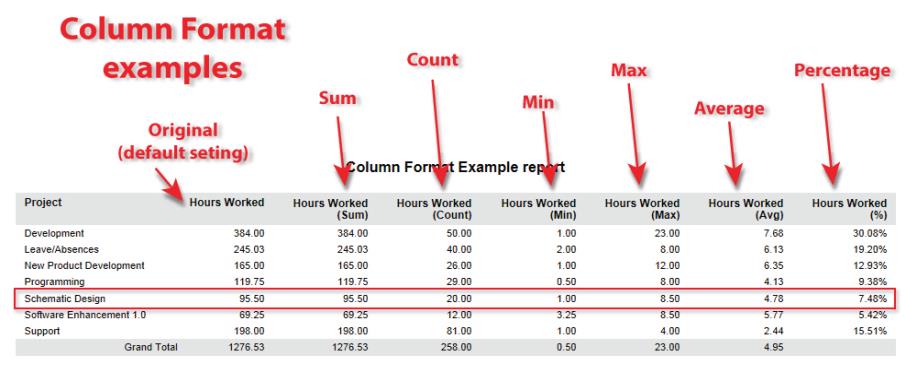
The image that follows is presented to highlight the different Column Format options. The report is also grouped by project name so that the individual time entries are not displayed. The same data column (Hours Worked) has been added 6 times, with each column having a different Column Format selection. Sum: Displays the sum of the individual items in the grouping. In the image, the Schematic Design project has a total of 95.5 hours. Count: Displays the total number of items in the grouping. In the image, the Schematic Design project has a total of 20 individual time entries. Min/Max: Displays the minimum (or maximum) value from the grouping. The individual time entry with the smallest/largest number of hours. In this case, the smallest time entry is for 1 hour and the largest time entry is for 8.5 hours Average: Displays the average value from the data within the grouping. The average hours across all individual time entries (95.50 hours /20 time entries). Percentage: Converts each grouping within the column to a percentage of the entire column's total. Development = 30.08% (384/1276.53), Leave/Absences = 19.20% (245.03/1276.53), etc.
|
(OPTIONAL)
On the Sorting
tab
The Sorting tab is used to change the order of data in a report. You can
set from which column to sort by and set whether to sort ascending or
descending.
-
From the Sortings list on the left, select the items to sort by and move them to the Selected Sortings list. The available list is comprised of those columns previously selected that can be logically sorted.
|
Note: Any Grouping previously selected has priority over any Sorting. |
-
Use the Sort Order drop-down list to select how the data column is sorted: Ascending (0 to 9, A to Z) or Descending.
-
When sorting by more than one item, re-order the items using the up and down arrow buttons.
(OPTIONAL) On the Filters tab
The Filters tab allows the report designer to pick which report filters are made available to the user running the report. For example, the report designer may choose to let the end user select projects, employees or a date range when running the report. As the report designer, you also have the ability to pre-select items and options for these report filters.
|
Note: A date filter is automatically applied to the most popular report types. |
-
From the Filters list on the left, select and move a filter to the selected list.
-
The filter and its options are displayed above the report preview area. By default, items or options may be preselected for you so that you may Preview the report.
-
Click Run Report if required.
-
A checkbox labeled 'Keep the filter picks made below when you save the report' is placed above the applied filters. This checkbox is made available so that your filter picks can be saved with the report. If this box is not checked, the end user is required to select items or options from each filter applied when the report is run.
Example using a Project list filter. -
-
If you've selected 3 projects from the project filter list and the 'Keep the filter selections..' box is checked when you click the Save button; then when the end user runs this report, it already has these 3 projects selected. The end user will still be able to make changes to the filter before running the report.
-
Under the same conditions, if the 'Keep the filter selections.. box is unchecked when you click Save, then the end user is required to pick at least 1 project from the project filter list.
-
-
A full list of all the filters and their functions can be found in the Report Filters topic.
-
Click Save. The report is now in the Private tab.
-
You may choose to publish it, keep it private or make it a favorite.
-
To make the report available to Time Entry users, follow the additional instructions in Reports for time entry users.
-
See Also